Please refer to important disclosures at the end of this report
1
Hawkins Cookers Ltd (HCL),
incorporated in 1959 by Mr. HD Vasudeva, operates
in two segments i.e. Pressure Cookers and Cookware. The pressure cookers are
marketed under the flagship brand Hawkins, Futura and Miss Mary; cookware is
sold under the Futura brand name.
Shift in trend towards organized sector to propel growth:
Currently, organized
market for cooker and cookware segment is ~60%, while the balance is
unorganized. We expect that the organized players will grow faster compared to
unorganized players owing to narrowing price ga
p, strong brand positioning and
superior quality of products, which in turn will benefit branded players like HCL.
Historically, HCL has outperformed TTK Prestige: Over the last 6-
7 years, HCL has
continuously outperformed TTK Prestige (market leader in
cookers and cookware
segment) in terms of sales growth mainly due to strong brand, higher ad spends,
new product launches and wide distribution network. We believe the company
would continue to outperform peers and increase its market share in this segment.
Increased penetration of cooking gas to drive growth:
Cooking gas (LPG)
penetration has increased to 95% currently from 56% in FY2014 mainly due to
Pradhan Mantri Ujjwala Yojana (PMUY) scheme. Notably, HCL and TTK Prestige
were unable to achieve strong r
evenue growth in cookers and cookware segment
in the past due to lower penetration of cooking gas. However, given the increased
penetration of cooking gas, HCL has witnessed strong growth in this segment
during the last six quarters, which is evident from its revenue growth numbers.
Falling raw material prices to aid margins: Aluminium is the
key raw material for
HCL, as it constitutes around ~ 20% of revenue
. Aluminium prices have started
softening from April 01, 2019, a correction of 7-8%. Moreover, the c
ompany had
already taken 4-
5% price hikes previously (to mitigate the increase in input costs in
FY18). Thus, going forward, we expect HCL’s margins to improve 80-
100bps on
the back of declining raw material prices.
Outlook and Valuation: We forecast HCL to report healthy top-
line CAGR of
~14% to `976cr over FY19-
22E on the back of government initiatives, new
product launches, strong brand name and wide distribution network. On the
bottom-line front (reported PAT), we estimate ~23% CAGR to `
100cr due to
str
ong revenue and operating margin improvement (on the back of correction in
raw material prices).
We initiate coverage on HCL with a Buy recommendation
and Target Price of `
4,353 (23x FY2022E EPS), indicating an upside of ~21%
from the current levels.
Key financials
Y/E March (` cr) FY2018 FY2019 FY2020E FY2021E FY2022E
Net Sales 553 653 751 856 976
% chg 7.9 18.1 15.0 14.0 14.0
Net Profit 49 54 76 87 100
% chg 2.7 11.4 40.5 14.6 14.7
OPM (%) 12.8 13.2 14.5 14.6 14.6
EPS (Rs) 92.0 102.5 144.0 164.9 189.3
P/E (x) 39.0 35.0 24.9 21.8 19.0
P/BV (x) 17.3 16.0 12.5 10.2 8.1
RoE (%) 44.3 45.7 50.0 46.7 42.8
RoCE (%) 49.6 55.0 56.9 54.8 51.2
EV/Sales (x) 3.3 2.9 2.5 2.2 1.9
EV/EBITDA (x) 26.1 22.0 17.4 15.1 13.2
Source: Company, Angel Research, Note: CMP as of January 08, 2020
BUY
CMP `3,591
Target Price `4,353
Investment Period 12 Months
Stock Info
Sector
Net Debt (
`
cr) (7)
Bloomberg Code
Shareholding Pattern (%)
Promoters 56.0
MF / Banks / Indian Fls 15.3
FII / NRIs / OCBs 1.5
Indian Public / Others 27.2
Abs. (%) 3m 1yr 3yr
Sensex 6.9 13.4 52.7
HCL 8.6 8.6 39.0
Reuters Code HWKN.BO
HAWK.IN
BSE Sensex 41,452
Nifty 12,216
Avg. Daily Volume 1,788
Face Value (
`
) 10
Beta 0.5
52 Week High / Low 4051/ 2606
Houseware
Market Cap (
`
cr) 1,941
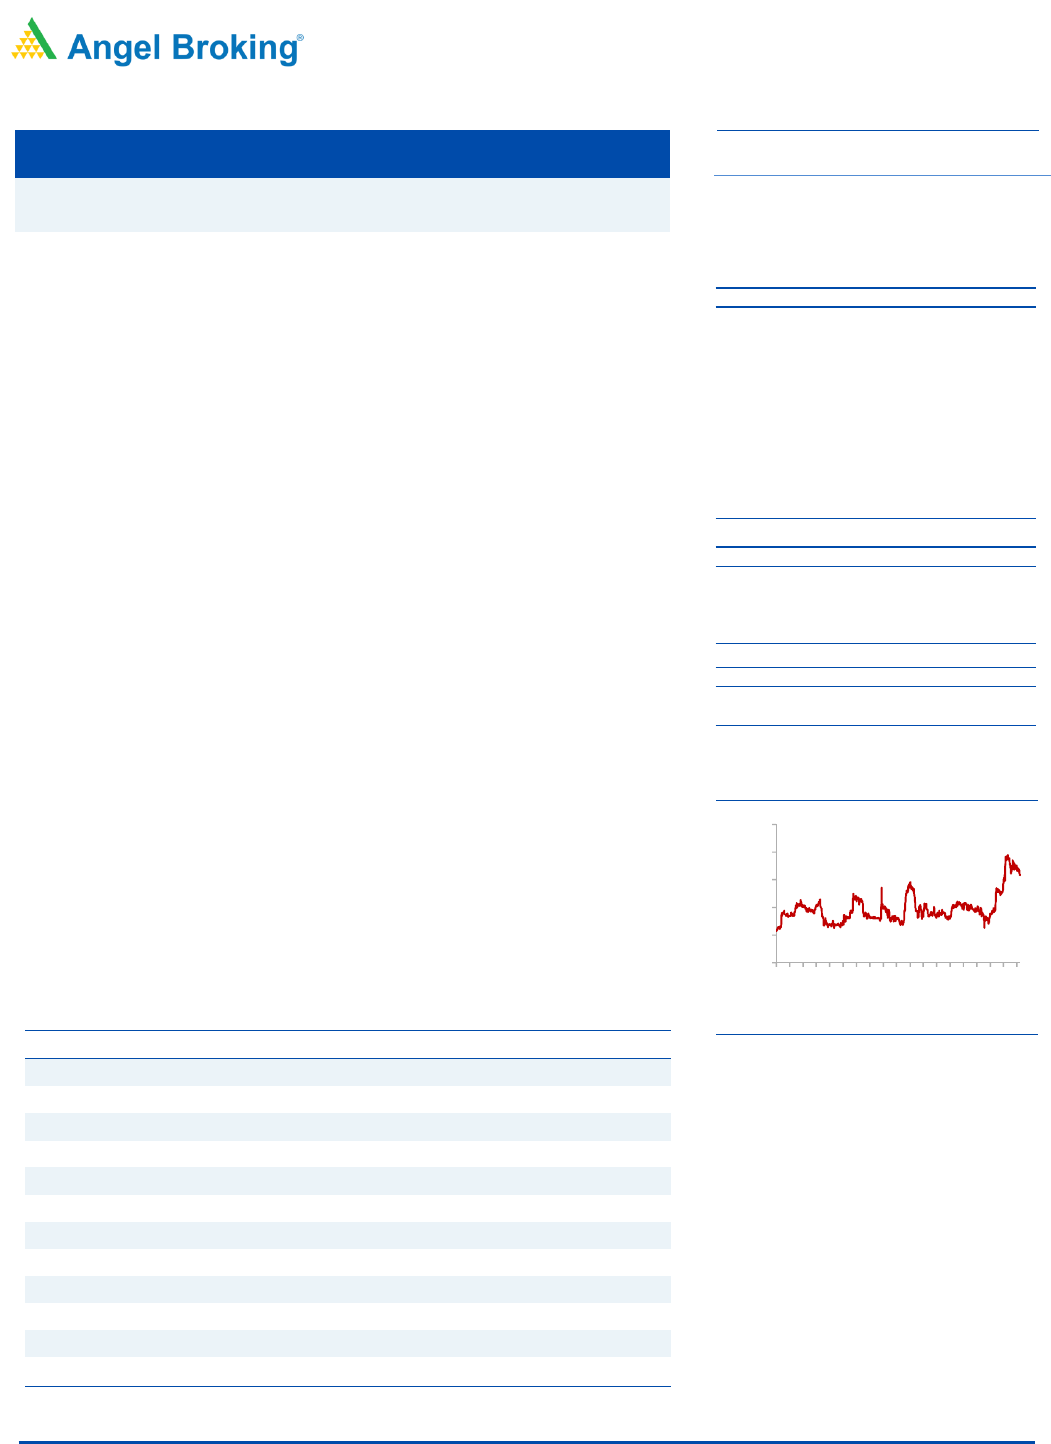
3 year daily price chart
Source: Company, Angel Research
Amarjeet S Maurya
022-39357800 Ext: 6831
amarjeet.maurya@angelbroking.com
2000
2500
3000
3500
4000
4500
Jan-17
Mar-17
May-17
Jul-17
Sep-17
Nov-17
Jan-18
Mar-18
May-18
Jul-18
Sep-18
Oct-18
Dec-18
Feb-19
Apr-19
Jun-19
Aug-19
Oct-19
Dec-19
Hawkins Cooker Ltd
Quick take
Hawkins Cooker
January 8, 2020
2
Quick take
Investment rationale
Shift in trend towards the organized sector to propel growth:
Currently, organized market for cooker and cookware segment is ~60%, while
the balance is unorganized. Over the years, it has been observed that the
share of unorganized players has been reducing gradually post GST
implementation. We expect that the organized players will grow faster
compared to unorganized players owing to narrowing price gap, strong brand
positioning and superior quality of products, which in turn will benefit branded
players like HCL.
Historically, HCL has outperformed TTK Prestige:
Over the last 6-7 years, HCL has continuously outperformed TTK Prestige
(market leader in cookers and cookware segment) in terms of sales growth
mainly due to strong brand, higher ad spends, new product launches and
wide distribution network. We believe the company would continue to
outperform peers and increase its market share in this segment.
Exhibit 1: Sales performance – Hawkins vs. TTK Prestige
Hawkins TTK Prestige Outperformed
Sales CAGR FY17-19 12.9% 3.9% 9.0%
Sales CAGR FY15-19 6.6% 4.6% 2.0%
Sales CAGR FY13-19 7.7% 3.8% 3.9%
Source: Company, Angel Research
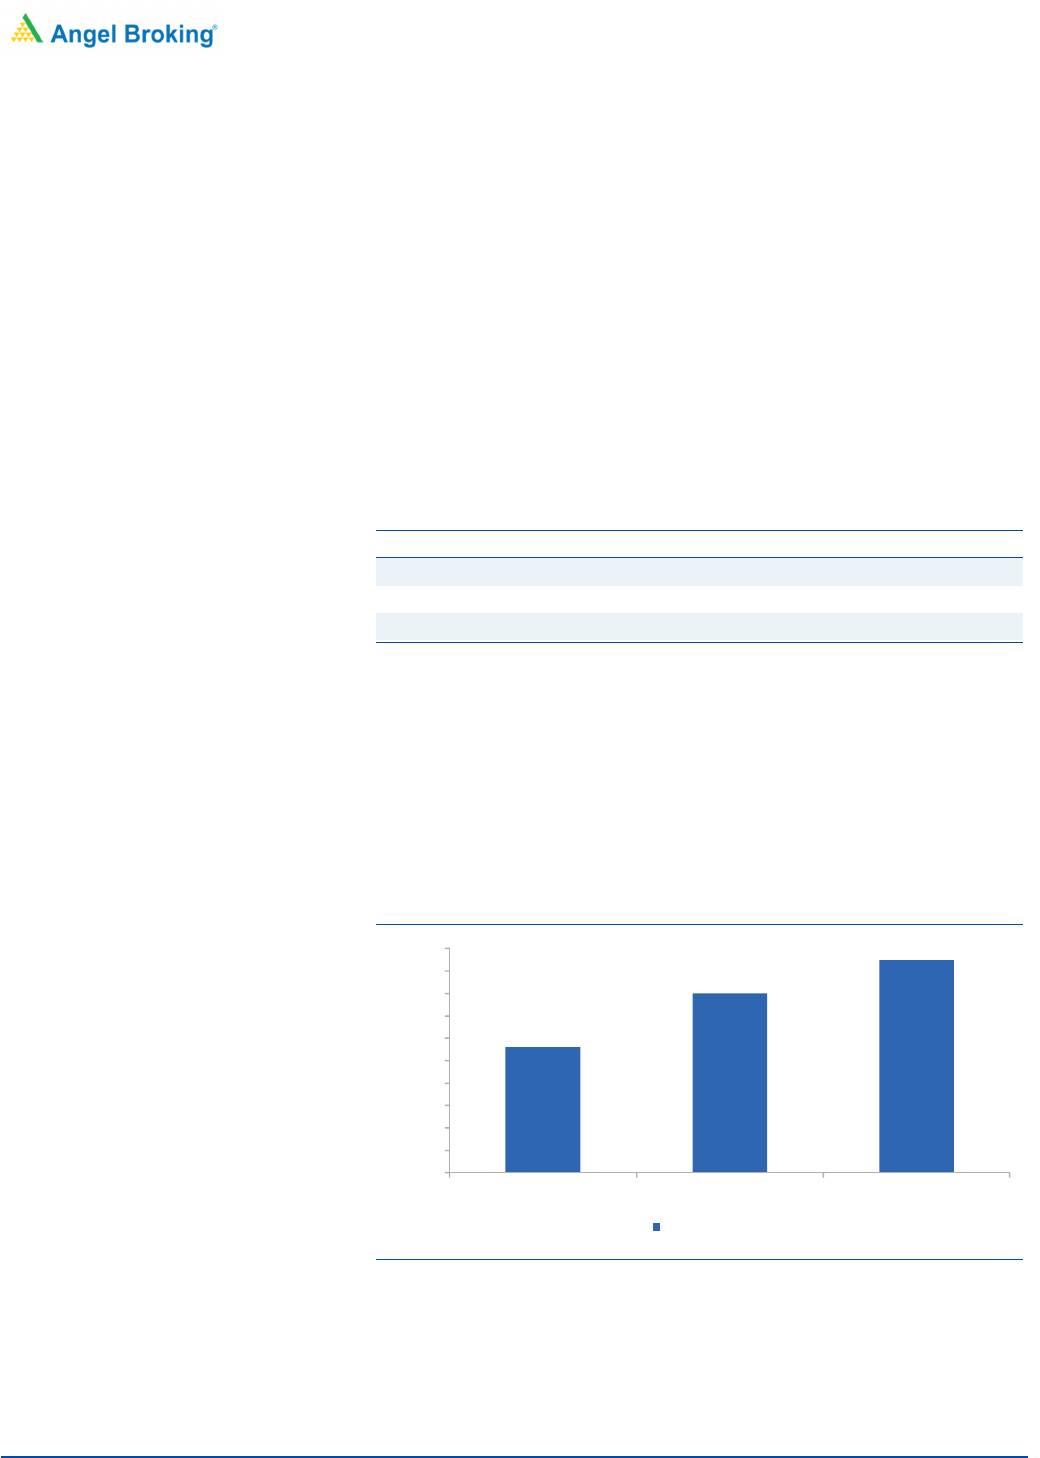
Increased penetration of cooking gas to drive growth:
Cooking gas (LPG) penetration has increased to 95% currently from 56% in
FY2014 mainly due to Pradhan Mantri Ujjwala Yojana (PMUY) scheme, which
was launched on May 01, 2016. The target of this scheme was to give 5cr
connections to women members of poor households by March 2019; the
target was later raised to 8cr connections by March 2020.
Exhibit 2: Increase in penetration of cooking gas
Source: Company, Angel Research
Notably, HCL and TTK Prestige were unable to achieve strong revenue growth
in cookers and cookware segment in the past due to lower penetration of
cooking gas. However, given the increased penetration of cooking gas, HCL
56%
80%
95%
0%
10%
20%
30%
40%
50%
60%
70%
80%
90%
100%
FY14 FY19 Currently
LPG penetration
Hawkins Cooker
January 8, 2020
3
Quick take
has witnessed strong growth in this segment during the last six quarters, which
is evident from its revenue growth numbers.
Exhibit 3: Strong growth momentum in last six quarters
Revenue cr FY18
FY19 yoy growth (%)
1HFY19
1HFY20
yoy growth (%)
Hawkins cookers 553 653 18.1% 293 335 14.0%
Source: Company, Angel Research
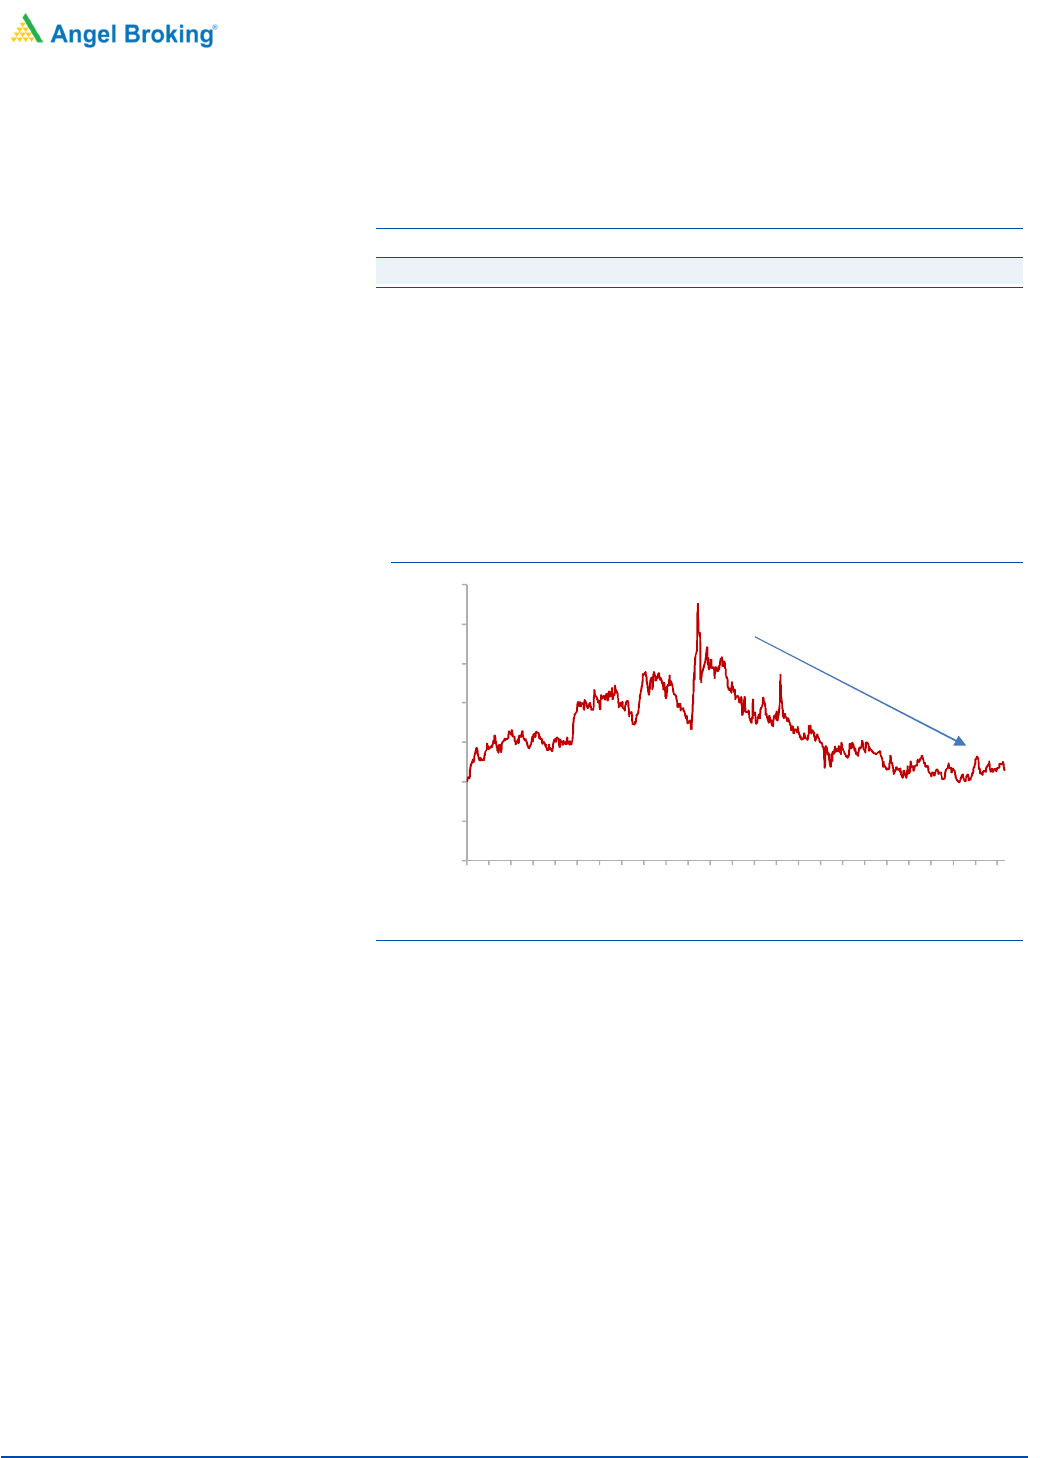
Falling raw material prices to aid margin:
Aluminium is the key raw material for HCL, as it constitutes around ~ 20% of
revenue. Aluminium prices have started softening from April 01, 2019, a
correction of ~7%. Moreover, the company had already taken 4-5% price
hikes previously (to mitigate the increase in input costs in FY18). Thus, going
forward, we expect HCL’s margins to improve 80-100bps on the back of
declining raw material prices.
Exhibit 4: Falling aluminium prices
Source: Company, Angel Research
1300
1500
1700
1900
2100
2300
2500
2700
Jan-17
Feb-17
Apr-17
May-17
Jul-17
Aug-17
Oct-17
Nov-17
Dec-17
Feb-18
Mar-18
May-18
Jun-18
Aug-18
Sep-18
Nov-18
Dec-18
Feb-19
Mar-19
May-19
Jun-19
Aug-19
Sep-19
Nov-19
Dec-19
$/Tonne
Hawkins Cooker
January 8, 2020
4
Quick take
Outlook and Valuation
We forecast HCL to report healthy top-line CAGR of ~14% to `976cr over
FY19-22E on the back of government initiatives, new product launches, strong
brand name and wide distribution network. On the bottom-line front (reported
PAT), we estimate ~23% CAGR to `100cr due to strong revenue and
operating margin improvement (on the back of correction in raw material
prices). We initiate coverage on HCL with a Buy recommendation and Target
Price of `4,353 (23x FY2022E EPS), indicating an upside of ~21% from the
current levels.
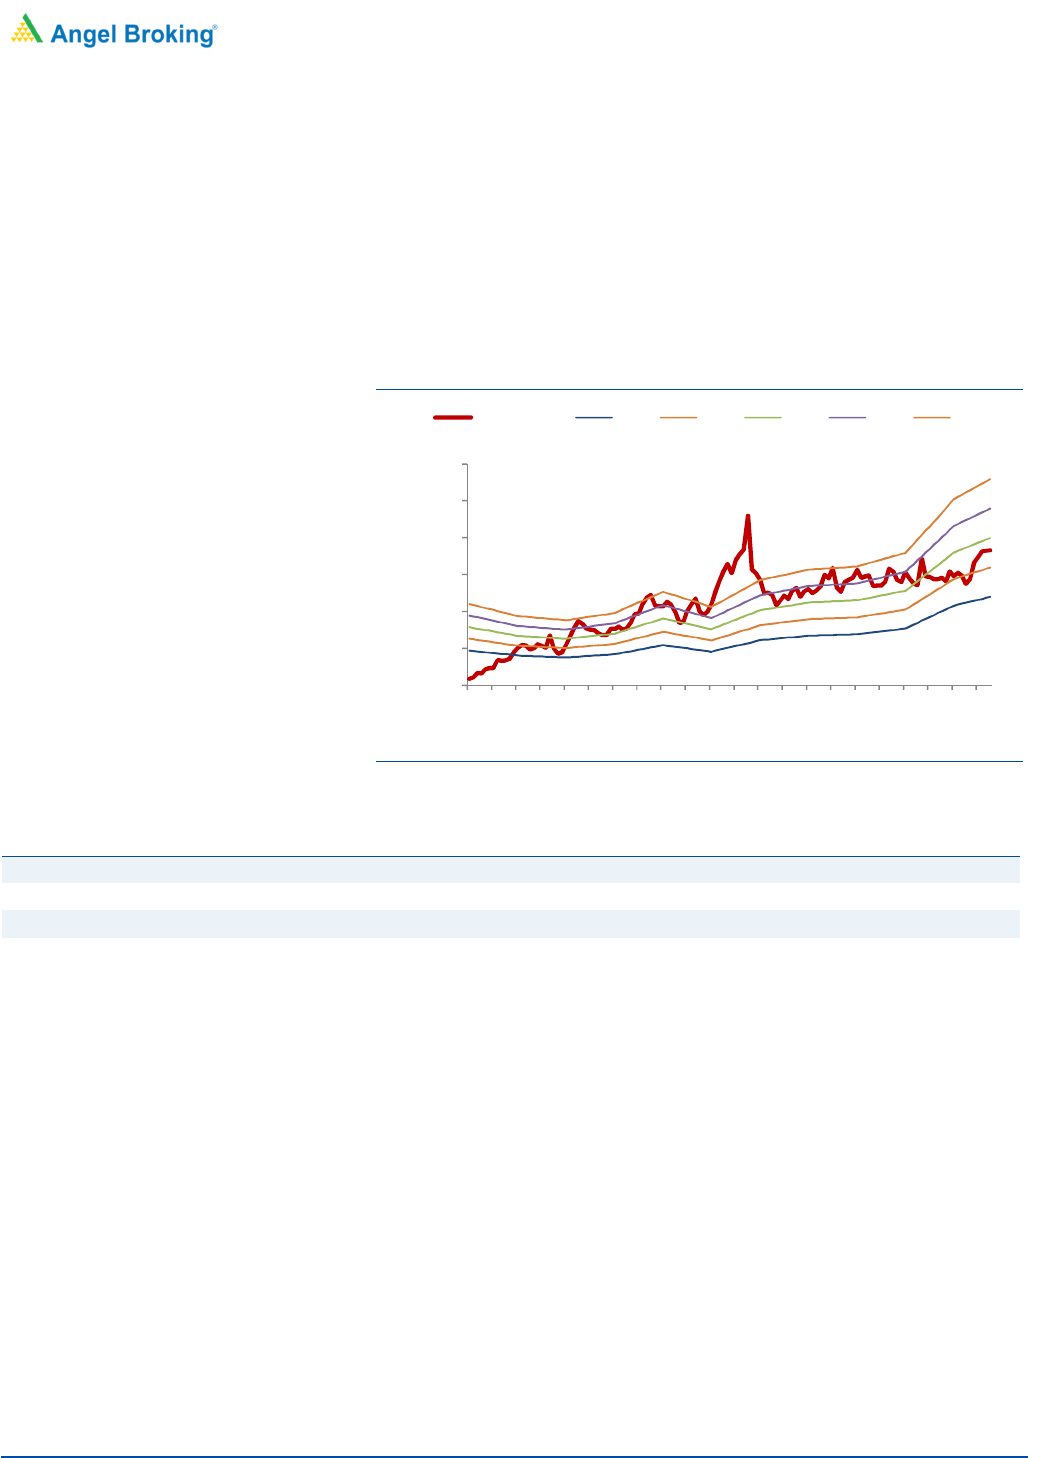
Exhibit 5: One year forward PE chart
Source: Company, Angel Research
Exhibit 6: Peer analysis
P/E (x) EV/Sales (x) ROE (%) ROCE (%)
Market Cap (`) FY20 FY21 FY20 FY21 FY20 FY21 FY20 FY21
HCL 1,900 24.9 21.8 2.5 2.2 50.0 46.7 20.2 19.7
TTK Prestige 7,793 33.0 29.6 3.3 2.9 17.4 16.8 56.9 54.8
Source: Company, Angel Research
Risks to our estimates
Volatile aluminium prices: Aluminium accounts for ~20% of net sales of HCL.
Volatility in aluminium prices will have a negative impact on the company’s
performance.
Economic slowdown: Economic slowdown will affect the performance of the
company.
Competition: Losing market share due to stiff competition could impact the
profitability of company.
Company background
0
1000
2000
3000
4000
5000
6000
Apr-09
Oct-09
Apr-10
Oct-10
Apr-11
Oct-11
Apr-12
Oct-12
Apr-13
Oct-13
Apr-14
Oct-14
Apr-15
Oct-15
Apr-16
Oct-16
Apr-17
Oct-17
Apr-18
Oct-18
Apr-19
Oct-19
(`)
Close -Unit Curr 15.0 X 20.0 X 25.0 X 30.0 X 35.0 X

Hawkins Cooker
January 8, 2020
5
Quick take
Hawkins Cookers Ltd (HCL)
was incorporated in 1959 by Mr. HD Vasudeva.
HCL operates in two segments i.e. Pressure Cookers and Cookware.
The
pressure cookers are marketed under the flagship brand Hawkins and also
under Futura and Miss Mary; cookware is sold
under the Futura brand name.
The company has approximately 75 models of pressure cookers in eleven
different varieties. Currently, the domestic market contributes around 94%
of
the overall sales and rest comes from overseas markets.
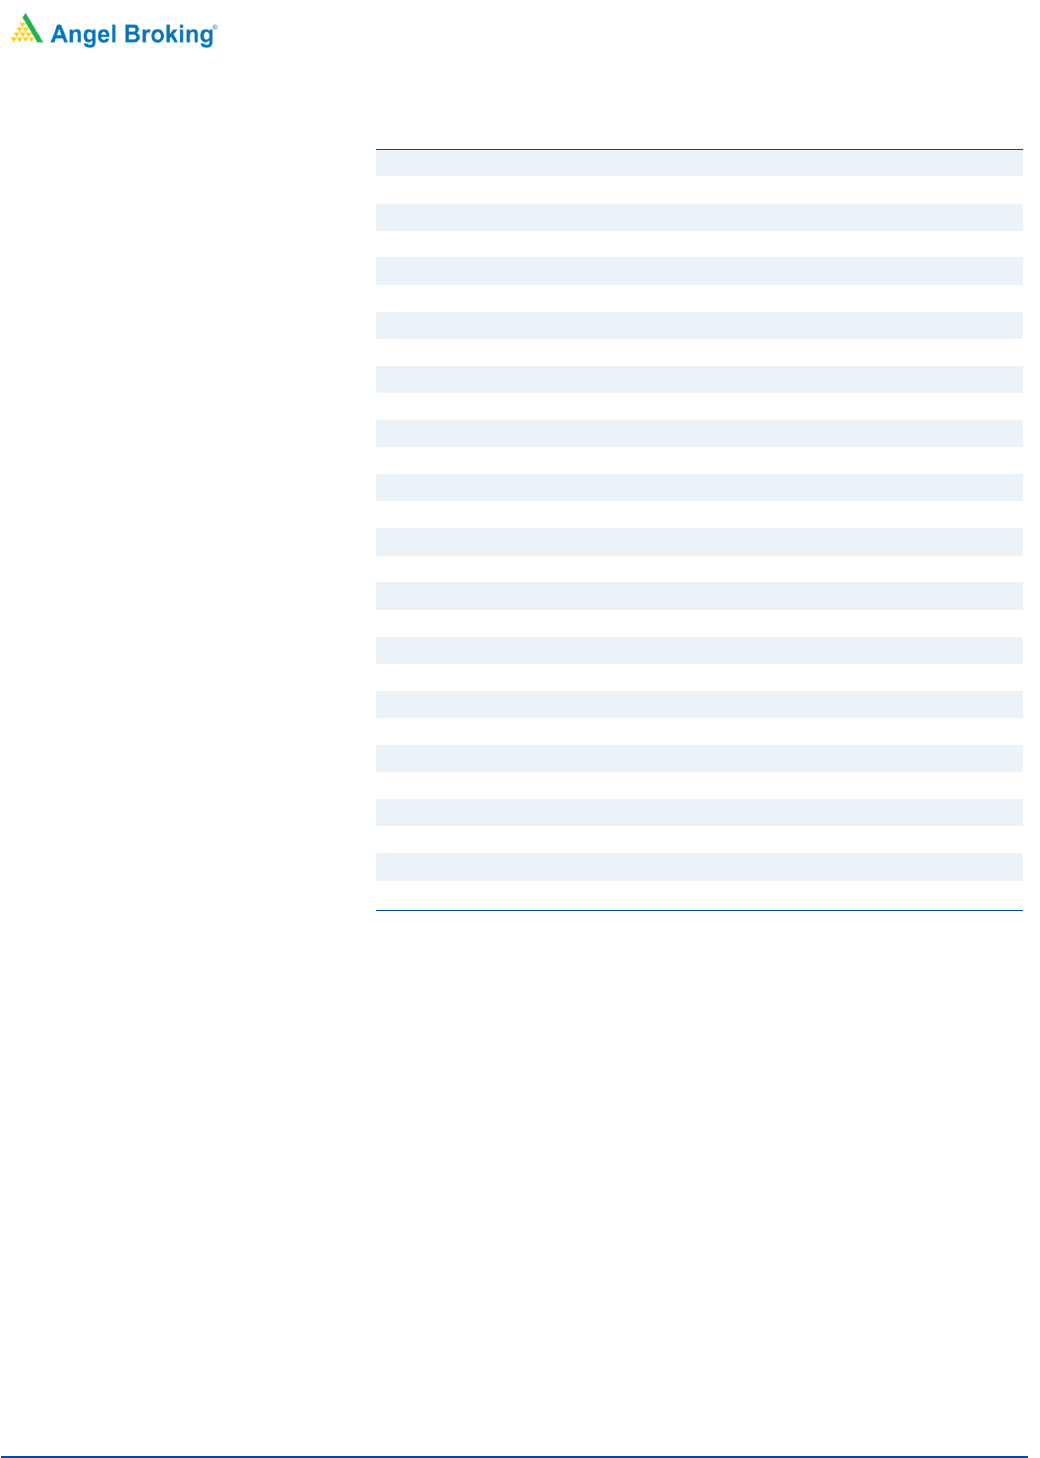
Profit & Loss Statement
Hawkins Cooker
January 8, 2020
6
Quick take
Y/E March (` cr) FY2018 FY2019
FY2020E
FY2021E FY2022E
Net Sales
553
653
751
856
976
% chg 7.9 18.1
15.0
14.0 14.0
Total Expenditure
482
567
642
731
833
Raw Material
261
293
334
381
434
Personnel
76
91
105
121
139
Others Expenses
145
182
203
229
261
EBITDA
71
86
109
125
142
% chg
(5.0)
22.2
26.3
14.8 14.0
(% of Net Sales) 12.8 13.2
14.5
14.6 14.6
Depreciation& Amortisation
4 4
5
6 7
EBIT
67
82
104
119
136
% chg
(5.5)
22.9
26.8
14.4 13.7
(% of Net Sales) 12.1 12.6
13.9
13.9 13.9
Interest & other Charges 4 4
4
4 4
Other Income
11
4
3
3 4
(% of PBT) 15.0 5.0
2.9
2.5 3.0
Recurring PBT
74
82
103
118
135
% chg 4.0 11.6
25.0
14.6 14.7
Tax
25
28
27
31
35
(% of PBT) 34.0 34.2
26.0
26.0 26.0
PAT (reported)
49
54
76
87
100
Extraordinary Items
-
-
-
-
-
ADJ. PAT
49
54
76
87
100
% chg 2.7 11.4
40.5
14.6 14.7
(% of Net Sales) 8.8 8.3
10.1
10.2 10.3
Basic EPS (`)
92.0
102.5
144.0
164.9
189.3
Fully Diluted EPS (`)
92.0
102.5
144.0
164.9
189.3
% chg 2.7 11.4
40.5
14.6 14.7
Hawkins Cooker
January 8, 2020
7
Quick take
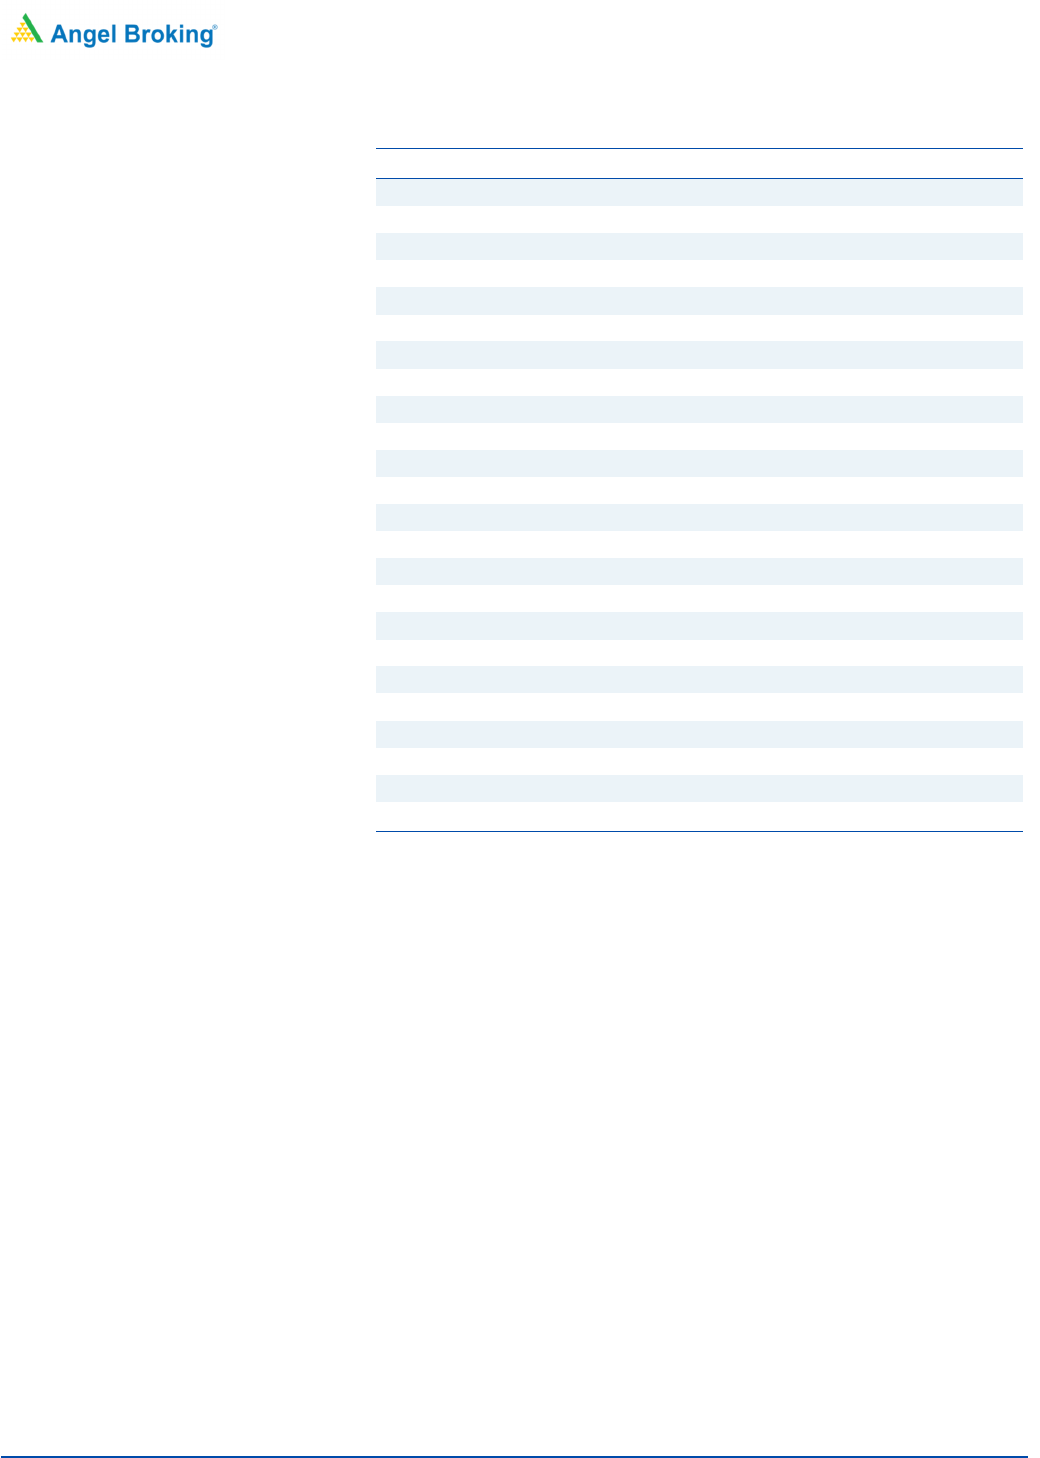
Balance Sheet
Y/E March (` cr) FY2018 FY2019 FY2020E FY2021E FY2022E
SOURCES OF FUNDS
Equity Share Capital
5
5
5
5
5
Reserves& Surplus
105
113
147
182
229
Shareholders Funds
110
119
152
187
234
Total Loans
25
31
31
31
31
Deferred Tax Liability
3
2
2
2
2
Total Liabilities
138
152
186
220
267
APPLICATION OF FUNDS
Gross Block
30
37
47
57
67
Less: Acc. Depreciation
7
11
15
21
28
Net Block
23
27
32
36
39
Capital Work-in-Progress
1
2
2
2
2
Investments
-
-
-
-
-
Current Assets
220
237
280
327
391
Inventories
67
100
119
138
160
Sundry Debtors
47
79
95
110
128
Cash
87
35
37
41
54
Loans & Advances
14
19
23
30
39
Other Assets
4
5
6
8
10
Current liabilities
111
118
132
149
169
Net Current Assets
109
119
148
178
222
Deferred Tax Asset
4
4
4
4
4
Mis. Exp. not written off
-
-
-
-
-
Total Assets
138
152
186
220
267

Hawkins Cooker
January 8, 2020
8
Quick take
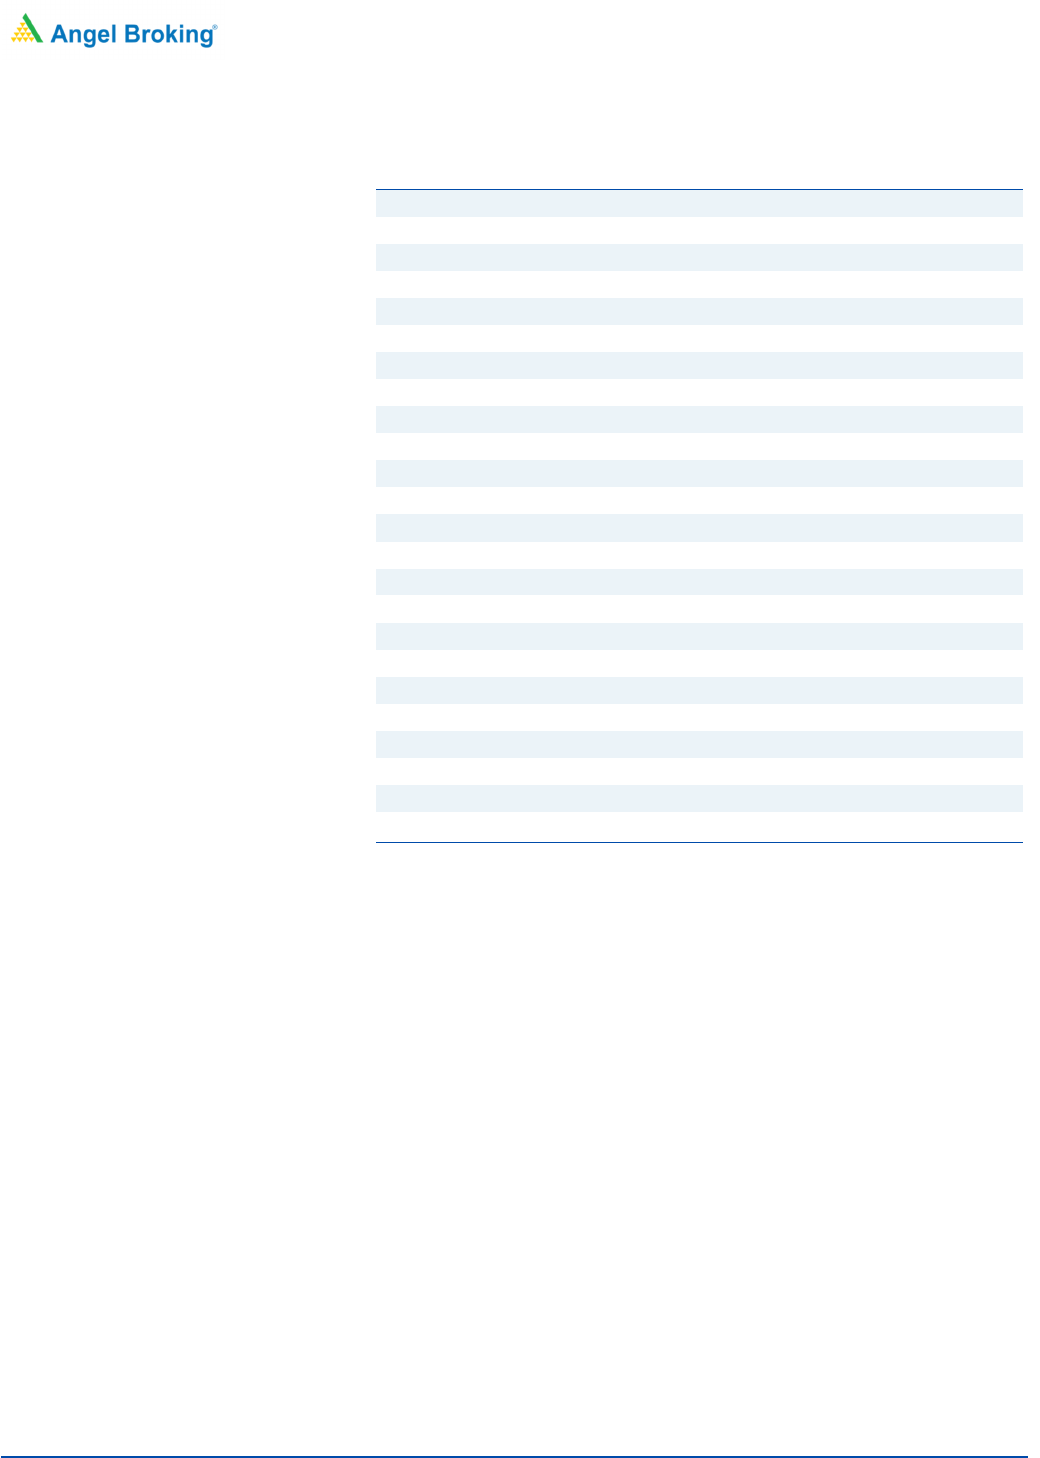
Cash flow Statement
Y/E March (` cr)
FY2018
FY2019
FY2020E
FY2021E
FY2022E
Profit before tax
74
82
103
118
135
Depreciation
4
4
5
6
7
Change in Working Capital
22
(62)
(26)
(26)
(31)
Interest / Dividend (Net)
(2)
0
4
4
4
Direct taxes paid
(22)
(28)
(27)
(31)
(35)
Others
(5)
(2)
0
0
0
Cash Flow from Operations
69
(6)
59
71
80
(Inc.)/ Dec. in Fixed Assets
(1)
(8)
(10)
(10)
(10)
(Inc.)/ Dec. in Investments
(12)
50
0
0
0
Cash Flow from Investing
(13)
42
(10)
(10)
(10)
Issue of Equity
0
0
0
0
0
Inc./(Dec.) in loans
7
6
0
0
0
Dividend Paid (Incl. Tax)
(44)
(45)
(42)
(53)
(53)
Interest / Dividend (Net)
3
(49)
(4)
(4)
(4)
Cash Flow from Financing
(35)
(87)
(47)
(57)
(57)
Inc./(Dec.) in Cash
22
(52)
2
4
13
Opening Cash balances
65
87
35
37
41
Closing Cash balances
87
35
37
41
54
Hawkins Cooker
January 8, 2020
9
Quick take
Key Ratios
Y/E March
FY2018 FY2019
FY2020E
FY2021E
FY2022E
Valuation Ratio (x)
P/E (on FDEPS) 39.0 35.0
24.9
21.8
19.0
P/CEPS 36.3 32.6
23.5
20.4
17.7
P/BV 17.3 16.0
12.5
10.2
8.1
Dividend yield (%) 1.9 1.9
2.2
2.8 2.8
EV/Sales 3.3 2.9
2.5
2.2 1.9
EV/EBITDA 26.1 22.0
17.4
15.1
13.2
EV / Total Assets 13.4 12.5
10.2
8.6 7.0
Per Share Data (Rs)
EPS (Basic) 92.0 102.5
144.0
164.9
189.3
EPS (fully diluted) 92.0 102.5
144.0
164.9
189.3
Cash EPS 98.9 110.1
152.8
175.9
202.3
DPS 70.0 70.0
80.0
100.0
100.0
Book Value
207.6
224.2
288.2
353.1
442.4
Returns (%)
ROCE 49.6 55.0
56.9
54.8
51.2
Angel ROIC (Pre-tax)
139.9
72.0
71.5
67.6
64.2
ROE 44.3 45.7
50.0
46.7
42.8
Turnover ratios (x)
Asset Turnover (Gross Block) 18.3 17.5
15.9
15.0
14.5
Inventory / Sales (days) 44 56
58
59
60
Receivables (days) 31 44
46
47
48
Payables (days) 34 30
30
30
30
Working capital cycle (ex-
cash) (days)
41 70
74
76
78
Source: Company, Angel Research

Hawkins Cooker
January 8, 2020
10
Quick take
Research Team Tel: 022
-
39357800 E
-
mail: research@angelbroking.
com Website:
www.angelbroking.com
DISCLAIMER
Angel Broking Limited (hereinafter referred to as “Angel”) is a registered Member of National Stock Exchange of India Limited, Bombay
Stock Exchange Limited and Metropolitan Stock Exchange Limited. It is also registered as a Depository Participant with CDSL and
Portfolio Manager and Investment Adviser with SEBI. It also has registration with AMFI as a Mutual Fund Distributor. Angel Broking
Limited is a registered entity with SEBI for Research Analyst in terms of SEBI (Research Analyst) Regulations, 2014 vide registration
number INH000000164. Angel or its associates has not been debarred/ suspended by SEBI or any other regulatory authority for
accessing /dealing in securities Market. Angel or its associates/analyst has not received any compensation / managed or co-managed
public offering of securities of the company covered by Analyst during the past twelve months.
This document is solely for the personal information of the recipient, and must not be singularly used as the basis of any investment
decision. Nothing in this document should be construed as investment or financial advice. Each recipient of this document should
make such investigations as they deem necessary to arrive at an independent evaluation of an investment in the securities of the
companies referred to in this document (including the merits and risks involved), and should consult their own advisors to determine
the merits and risks of such an investment.
Reports based on technical and derivative analysis center on studying charts of a stock's price movement, outstanding positions and
trading volume, as opposed to focusing on a company's fundamentals and, as such, may not match with a report on a company's
fundamentals. Investors are advised to refer the Fundamental and Technical Research Reports available on our website to evaluate the
contrary view, if any
The information in this document has been printed on the basis of publicly available information, internal data and other reliable
sources believed to be true, but we do not represent that it is accurate or complete and it should not be relied on as such, as this
document is for general guidance only. Angel Broking Limited or any of its affiliates/ group companies shall not be in any way
responsible for any loss or damage that may arise to any person from any inadvertent error in the information contained in this report.
Angel Broking Limited has not independently verified all the information contained within this document. Accordingly, we cannot testify,
nor make any representation or warranty, express or implied, to the accuracy, contents or data contained within this document. While
Angel Broking Limited endeavors to update on a reasonable basis the information discussed in this material, there may be regulatory,
compliance, or other reasons that prevent us from doing so.
This document is being supplied to you solely for your information, and its contents, information or data may not be reproduced,
redistributed or passed on, directly or indirectly.
Neither Angel Broking Limited, nor its directors, employees or affiliates shall be liable for any loss or damage that may arise from or in
connection with the use of this information.
Ratings (Based on expected returns
Buy (> 15%)
Accumulate (5% to 15%)
Neutral (
-
5 to 5%)
over 12 months investment period):
Reduce (
-
5% to
-
15%)
Sell (<
-
15
)
Disclosure of Interest Statement
Hawkins Cookers
1. Financial interest of research analyst or Angel or his Associate or his relative No
2. Ownership of 1% or more of the stock by research analyst or Angel or associates or relatives No
3. Served as an officer, director or employee of the company covered under Research No
4. Broking relationship with company covered under Research No